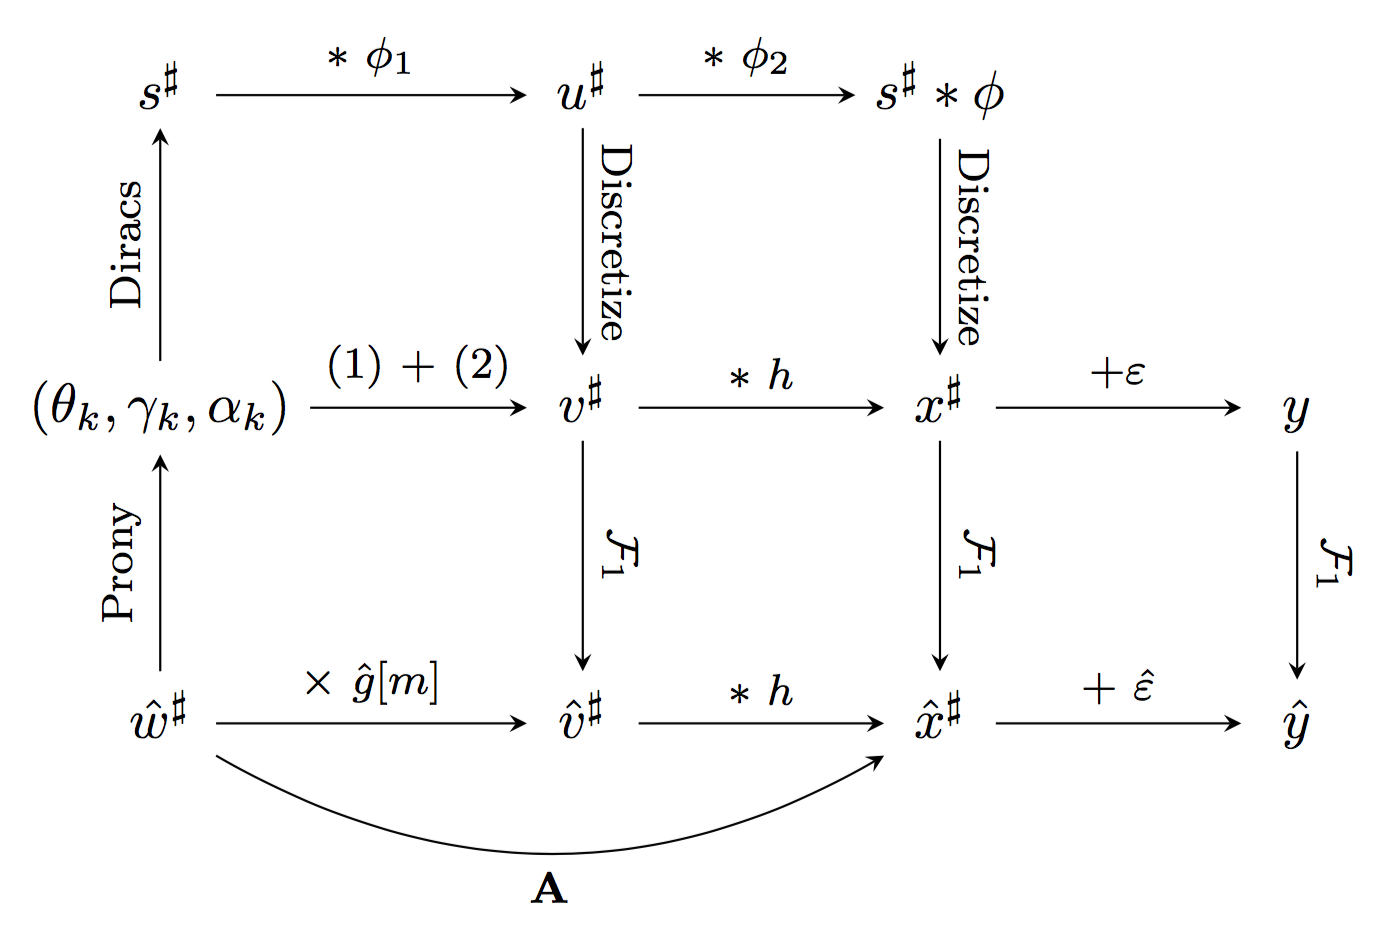
On est souvent amené à devoir faire de jolis schémas/diagrammes plus ou moins complexes pour illustrer une méthode ou un résultat. TikZ est un langage permettant justement de créer des images vectorielles sur mesure. En contrepartie il demande un certain investissement avant d'obtenir le résultat escompté. Les manuels de références sont pgf manual (complet en anglais) et TikZ pour l'impatient (pour une première prise en main). Je me sers également souvent du memo Visual TikZ récapitulant les commandes usuelles. Ceci dit le plus simple reste encore de s'inspirer du code des autres pour créer ses propres figures. Le site TeXample répertorie plusieurs figures TikZ associé du code correspondant. J'exposerai quant à moi mes réalisations personnelles sur cette page.
Comment créer un diagramme commutatif avec TikZ ?
\documentclass{article}
\usepackage{tikz}
\usetikzlibrary{matrix}
 \usepackage{tikz-cd}
\begin{document}
\begin{tikzpicture}
      \matrix (m) [matrix of math nodes,row sep=4em,column sep=4em,minimum width=2em,nodes={asymmetrical rectangle}]
      {
         s^{\sharp} & u^{\sharp}  & s^{\sharp}\ast \phi \\
         (\theta_k,\gamma_k,\alpha_k) & v^{\sharp} & x^{\sharp} & y \\
         \hat w^{\sharp} & \hat v^{\sharp} & \hat x^{\sharp} & \hat y\\
      };

        % First column
        \draw [->,-stealth] (m-2-1) edge node [sloped, anchor=center,above] {\footnotesize Diracs} (m-1-1);
        \draw [->,-stealth] (m-3-1) edge node [sloped, anchor=center,above] {\footnotesize Prony} (m-2-1);

        % Second column
        \draw [->,-stealth] (m-1-2) edge node [sloped, anchor=center,above] {\footnotesize Discretize} (m-2-2);
        \draw [->,-stealth] (m-2-2) edge node [sloped, anchor=center,above] {\footnotesize $\mathcal{F}_1$} (m-3-2);

         % Third column
        \draw [->,-stealth] (m-1-3) edge node [sloped, anchor=center,above] {\footnotesize Discretize} (m-2-3);
        \draw [->,-stealth] (m-2-3) edge node [sloped, anchor=center,above] {\footnotesize $\mathcal{F}_1$} (m-3-3);

        % Forth column
        \draw [->,-stealth] (m-2-4) edge node [sloped, anchor=center,above] {\footnotesize $\mathcal{F}_1$} (m-3-4);

        % First row
         \path [-stealth] (m-1-1) edge node [above] {\footnotesize $\ast~\phi_1$} (m-1-2);
         \path [-stealth] (m-1-2) edge node [above] {\footnotesize $\ast~\phi_2$} (m-1-3);

        % Second row
        \path [-stealth] (m-2-1) edge node [above] {\footnotesize (1) + (2)} (m-2-2);
        \path [-stealth] (m-2-2) edge node [above] {\footnotesize $\ast~h$} (m-2-3);
        \path [-stealth] (m-2-3) edge node [above] {\footnotesize $+\varepsilon$} (m-2-4);

         % Third row
        \path [-stealth] (m-3-1) edge node [above] {\footnotesize $\times~\hat g[m]$} (m-3-2);
        \path [-stealth] (m-3-2) edge node [above] {\footnotesize $\ast~h$} (m-3-3);
        \path [-stealth] (m-3-3) edge node [above] {\footnotesize $+~\hat \varepsilon$} (m-3-4);

        % Curved arrow
        \draw [->,-stealth,bend right] (m-3-1) edge node [below] {\footnotesize $\mathbf{A}$} (m-3-3);\end{tikzpicture}
remarque : les noeuds sont stockés dans une matrice, et l'option "nodes={asymmetrical rectangle}" permet d'aligner les flèches du diagramme convenablement.


